AdityalalwaniShopping Application in Flutter-DartFully functional Shopping Application in Flutter — Dart.Nov 15, 2021Nov 15, 2021
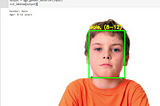
AdityalalwaniUsing image data, predict the gender and age range of an individual in Python.What is Computer Vision?Oct 29, 2021Oct 29, 2021
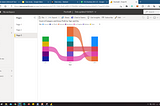
AdityalalwaniBuild a Power BI ReportFrom visualization select a ribbon chart to visualize data which data category has the highest rank (largest value).Oct 29, 2021Oct 29, 2021
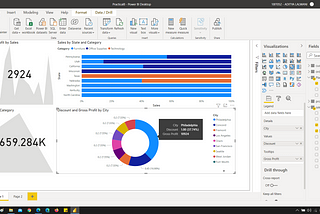
AdityalalwaniBuild a simple dashboard in PowerBIPower BI dashboard is a tool businesses use to help track, analyse, and display data, usually to gain deeper insight into the overall…Oct 29, 2021Oct 29, 2021
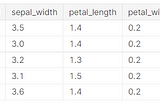
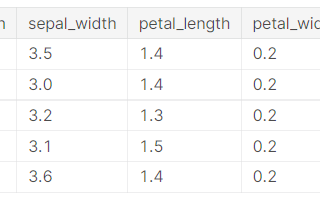
AdityalalwaniData Pre-processing tasks using pythonDataset Used: Iris DatasetOct 29, 2021Oct 29, 2021
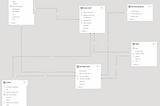
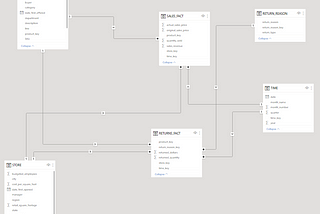
AdityalalwaniIntroduction to PowerBI and Get started with PowerBI, Prepare data for analysis and Model data in…What is Power BI?Oct 9, 2021Oct 9, 2021